- Sheridan, Wyoming, US
- [email protected]

- Call Us Anytime+123 (4567) 890
- Email Us[email protected]
- Opening HourMon - Sat 8:00 - 6:30, Sunday - CLOSED

Get latest update for our trusted applications

Energy & Hydropower


A day of unplanned downtime is measured in megawatt hours you can never sell.
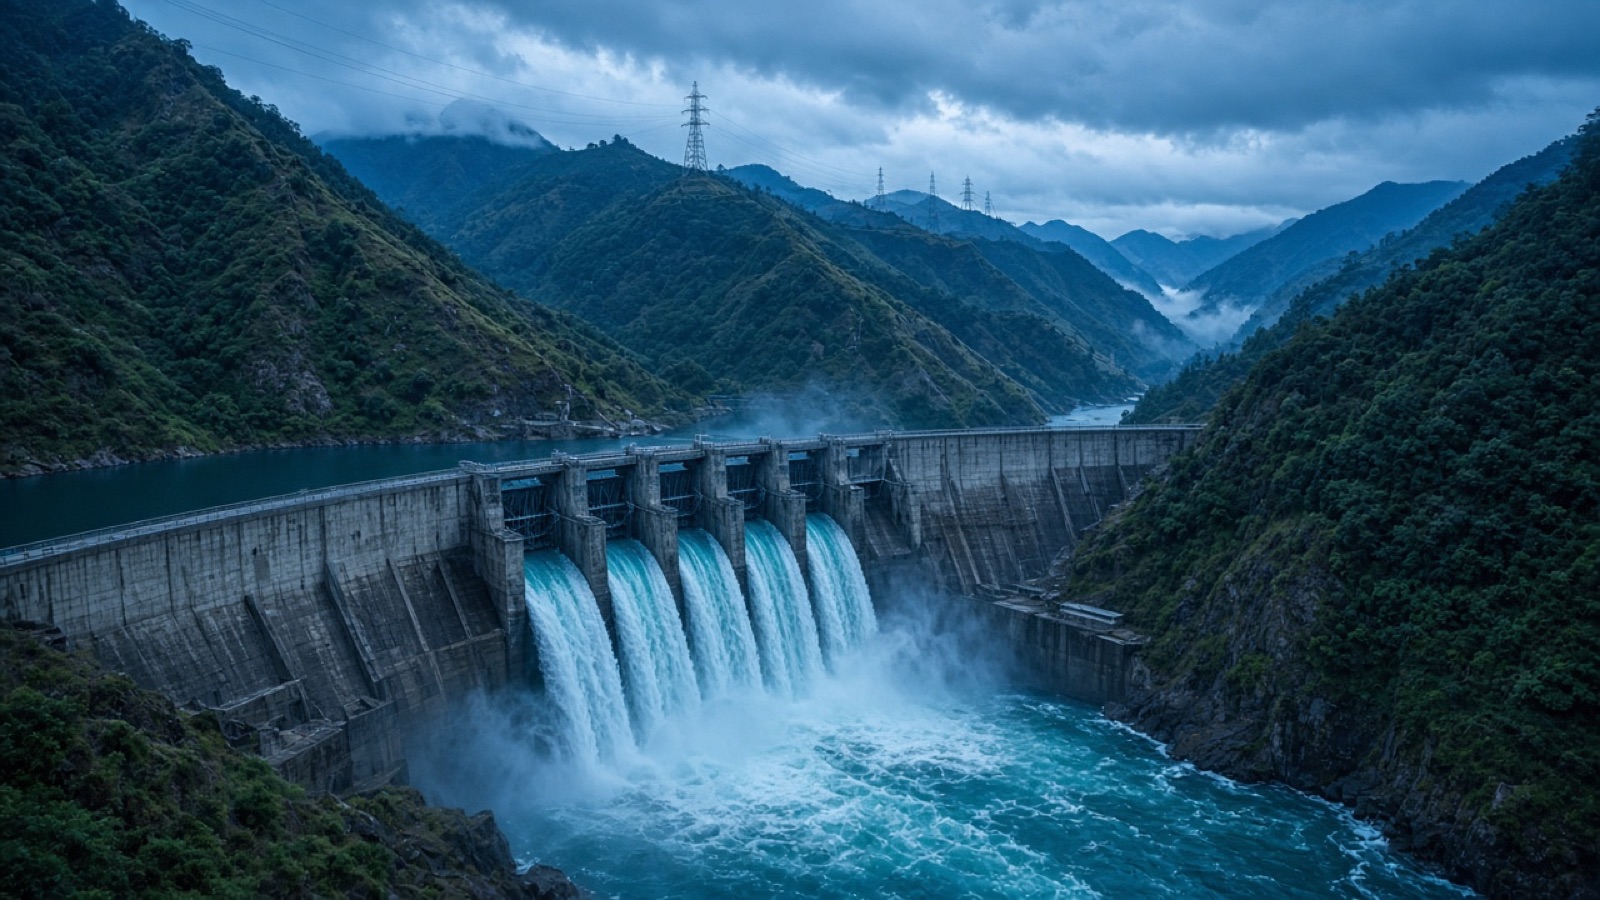
Generation assets have a brutal simplicity: output is either produced and sold or lost forever. We work inside Yashoda Group hydropower operations on forecasting, predictive maintenance and inspection — the three things that decide how much of the available water becomes revenue.
−34%
downtimeReduction in unplanned outage hours
+6.2%
generationOutput gain from dispatch and forecasting
−28%
maintenance costEmergency work converted to planned
The bearing that failed on a Sunday during peak flow.
A generation unit failed during the highest-flow week of the season. The repair took nine days. The water kept arriving and kept spilling past a stationary turbine, and every hour of that was revenue which could not be recovered later — hydropower does not permit catching up.
The historian data showed the failure had been developing for eleven weeks. Vibration signature, bearing temperature and a subtle efficiency decline were all present and all visible to anyone reviewing the right combination of series. Nobody was, because there were four thousand tags and three engineers.
Predictive maintenance is not a sophisticated idea in this sector; it is arithmetic that the industry has been slow to act on. Modelling the failure signatures, alerting on developing anomalies and scheduling intervention during low-flow windows cut unplanned downtime by 34%. The data was already being collected. Nobody was reading it.
We had eleven weeks of warning in a system nobody had time to look at.
Six applications that protect generation revenue.
In generation, almost all value reduces to one question: how much of the available resource became sellable output?
Predictive maintenance
Model failure signatures across vibration, temperature, pressure and efficiency series to intervene during planned windows instead of during peak flow.
Generation & inflow forecasting
Forecast inflow and generation using hydrology, weather, snowmelt and historical patterns to improve dispatch planning and commitment accuracy.
Vision-based asset inspection
Drone and fixed-camera inspection of penstocks, spillways, transmission structures and civil works, with change detection between surveys.
Efficiency & loss analytics
Identify gradual efficiency decline, spill events, auxiliary consumption and transmission losses that are individually small and collectively expensive.
Site safety monitoring
Continuous verification of PPE compliance, restricted-zone entry and lockout procedures on existing camera infrastructure, anonymised by design.
Regulatory & investor reporting
Automated generation, availability and compliance reporting for regulators, offtakers and investors from a single governed data layer.
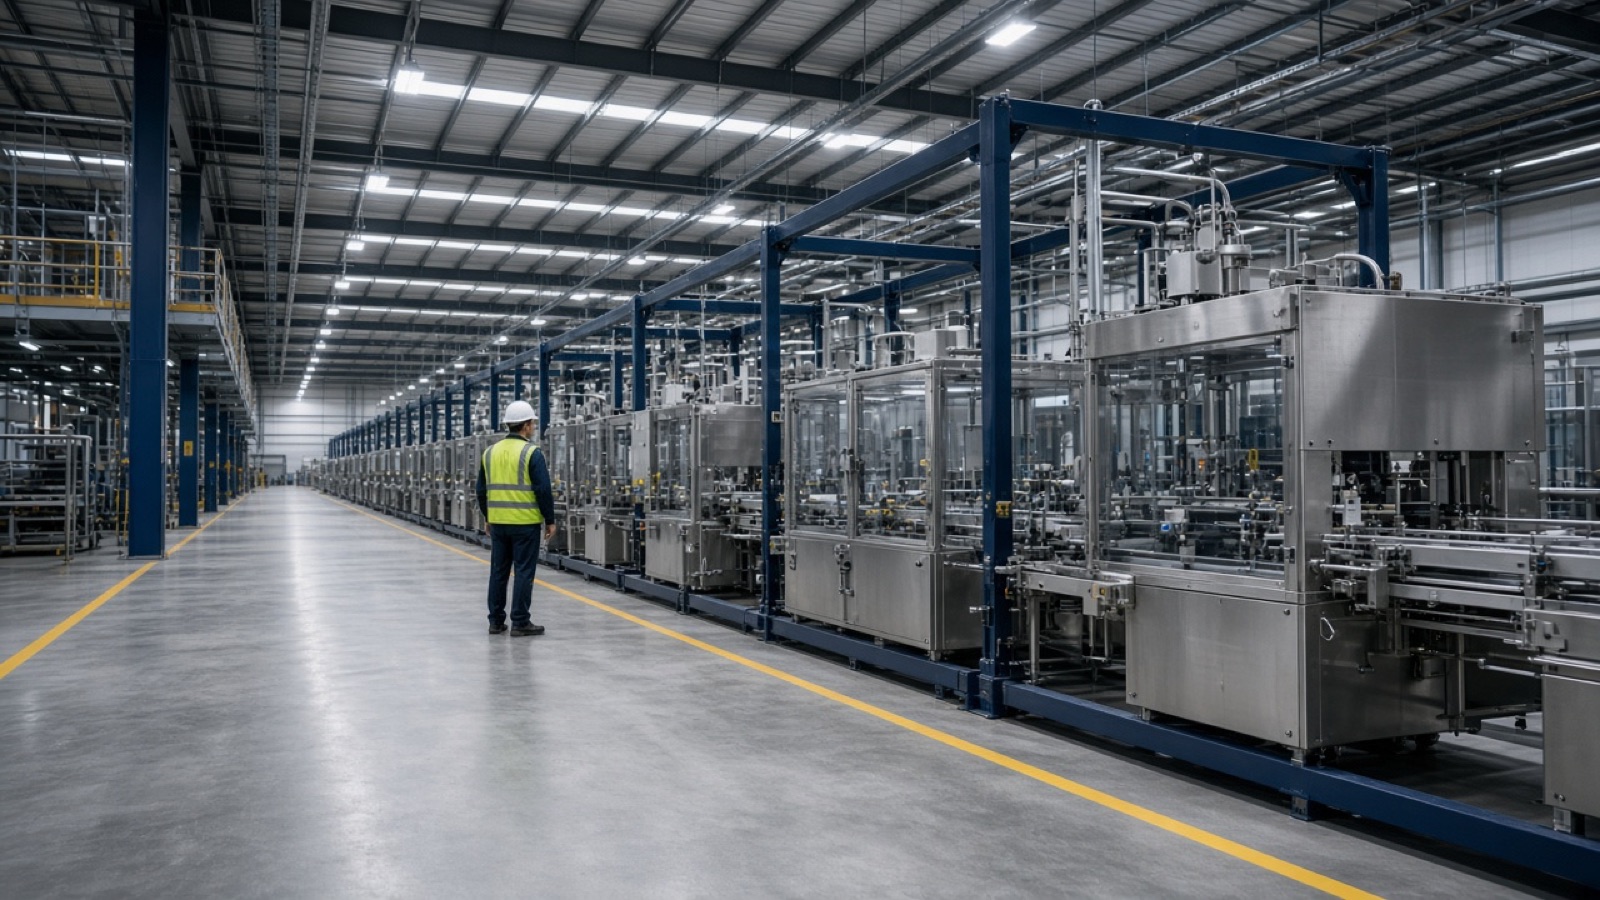
What changes at a generation asset.
Each of these is written into the engagement as a number with an owner, a baseline and a review date.
OUTCOME 01
Lost generation becomes recovered revenue
Every avoided outage hour during high flow converts directly into sellable output. In hydropower this is the clearest and largest value line available.
OUTCOME 02
Maintenance becomes planned work
Converting emergency repairs into scheduled interventions during low-flow windows reduces both the cost of the work and the revenue lost while it happens.
OUTCOME 03
Inspection stops requiring shutdown
Vision-based inspection of civil and mechanical assets reduces the need for access-driven outages and produces a dated evidence trail for regulators and insurers.
Built for remote industrial sites.
- SCADA and historian integration without disturbing control systems
- Failure signature models for your specific units and conditions
- Edge deployment that continues operating through connectivity loss
- Alerting into the systems your operations team already watches
- Inspection workflow with dated photographic evidence and change detection
- Governed reporting for regulators, offtakers and investors
The engineering underneath.
Numbers from work already in production.
Measured against the baseline agreed with the client before the engagement started.
−34%
Unplanned downtimePredictive maintenance on generation units
+6.2%
Generation outputForecasting and dispatch improvement
11 wks
Advance failure warningOn the signature that caused a 9-day outage
What plant and asset managers ask.
- 01. Will this touch our control systems?No. We read from historians, gateways and exports. Our systems advise and alert; they do not write to control loops. Any change to that boundary would be a separate, deliberate engineering decision with your safety authority involved.
- 02. Our site connectivity is unreliable. Does that rule this out?It is the reason we deploy at the edge. Inference runs on site and only events and summaries travel upstream, so the system keeps working through outages.
- 03. How much history do you need?Ideally two years of historian data including at least a few failure events. Where failures are rare we start with anomaly detection against normal operation, which requires no labelled failures at all.
- 04. Do you work with solar and thermal as well as hydro?Yes. Hydropower is our deepest experience through the group, and the forecasting, maintenance and inspection patterns transfer directly to other generation types.
Where to go next.

Send us two years of historian data. We will find the failures you have not had yet.
The assessment reviews your historian, maintenance records and outage history, then quantifies the generation recoverable through prediction and planning.