- Sheridan, Wyoming, US
- [email protected]

- Call Us Anytime+123 (4567) 890
- Email Us[email protected]
- Opening HourMon - Sat 8:00 - 6:30, Sunday - CLOSED







Get latest update for our trusted applications

Case Studies


Six engagements, and the number each one moved.
Each of these begins with a value model agreed before the work started and ends with a figure measured against a baseline someone in finance verified. Clients are anonymised where commercial sensitivity requires it; references are available during procurement.

120+
projectsDelivered across 18 industries
$1.7B
valueCumulative client value generated
99%
retentionClients continuing after project one
Representative engagements, not a highlight reel.
These six were selected to cover our main sectors and capability mix rather than to show our largest numbers. Two of them — the telecom churn work and the hospitality deployment — began by contradicting what the client had asked us to build, which is a more useful thing to read about than a project that went exactly to plan.
Each entry states the problem as we found it, the work we actually did, and the outcome as it was reported to the client's accountable executive. Where a randomised holdout was used, the improvement quoted is incremental.
Solving loan management from its root.
A specialist lender was losing good deals to faster competitors. Credit judgement was excellent; turnaround was four days, driven by six thousand pages a month of statements, valuations and titles being read by three analysts. Borrowers with property under offer could not wait.
Document intelligence with citation-level traceability, a decision policy encoding their real credit rules, a purpose-built origination and servicing platform, and human review reserved for genuine judgement. Every extracted value cites the page it came from, which is what got the credit committee's approval.
Turnaround fell from four days to under four hours on the same credit standards. Qualified conversion rose 60% and work efficiency 72%. The analysts stopped transcribing and started underwriting a materially larger book.
4 days → 4 hrs
turnaroundCredit decision cycle time
+60%
conversionQualified applicant conversion
+72%
efficiencyWork efficiency across the team
Solving real estate operations from its root.
A property group asked us to optimise marketing spend. Their call logs showed 31% of inbound calls unanswered — evenings, weekends and, worst of all, the peak hour after a campaign launched. They were paying to generate demand and dropping a third of it.
A multilingual voice agent that answers every call, identifies the listing, qualifies the caller and books viewings directly into the CRM. Behind it, enquiry routing, nurture, tenancy administration, maintenance, inspections and owner reporting connected end to end.
Recovered the unanswered third of demand and lifted lead generation 75% on unchanged campaign spend. Qualified web traffic rose 90% and organic search performance 80%. Response time went from two days to four minutes.
+75%
leadsQualified lead generation
+90%
trafficQualified web traffic
2 days → 4 min
responseFirst response to an enquiry
The churn model that finally changed churn.
The operator had a churn model with 91% accuracy that had been running for a year without moving churn at all. The output went to a retention team that discounted everyone on the list, including customers who were never going to leave.
A subscriber context layer unifying network, billing, care and app signals, then the missing half: a decision policy choosing who is worth saving on margin, which intervention is cheapest and most effective, and through which channel — with a randomised holdout so value was provable.
Churn fell 31% while retention spend fell 19%, because discounting stopped going to customers who were staying anyway. Care containment rose 41% after voice agents were added across six high-volume intents.
−31%
churnSubscriber attrition, holdout-measured
−19%
save spendRetention discounting removed
+41%
containmentCare interactions resolved without a human

Eleven weeks of warning nobody was reading.
A generation unit failed during the highest-flow week of the season and took nine days to repair. Water kept arriving and spilling past a stationary turbine — revenue that hydropower can never recover later. The historian showed the failure developing for eleven weeks across four thousand tags nobody had time to review.
Failure signature modelling across vibration, temperature, pressure and efficiency series, anomaly detection against normal operation, alerting into the systems operators already watch, and edge deployment that survives the site's unreliable connectivity.
Unplanned downtime fell 34% and generation output rose 6.2% through better dispatch and forecasting. Emergency repairs became scheduled interventions timed for low-flow windows, cutting maintenance cost 28%.
−34%
downtimeUnplanned outage hours
+6.2%
generationOutput from forecasting and dispatch
−28%
maintenanceCost, emergency converted to planned

Paying commission on guests who had already called us.
A fortnight of reservation-line logging showed the busiest enquiry hour was also the busiest hour at the front desk. Unanswered callers did not disappear — they booked the same property through an online travel agent minutes later, at fifteen to eighteen per cent commission.
A multilingual voice agent handling availability, rate, amenity and booking questions at any hour, plus rate optimisation against forecast demand, event calendars and competitor position with parity constraints encoded as hard rules.
Direct booking share rose 21% and RevPAR 14%. The commission avoided on reservations moved to the direct channel is a permanent percentage saving against a one-off system cost.
+21%
direct shareBookings recovered from OTA channels
+14%
RevPARRevenue per available room
15–18%
commissionAvoided per recovered reservation

A three-week waiting list and empty chairs.
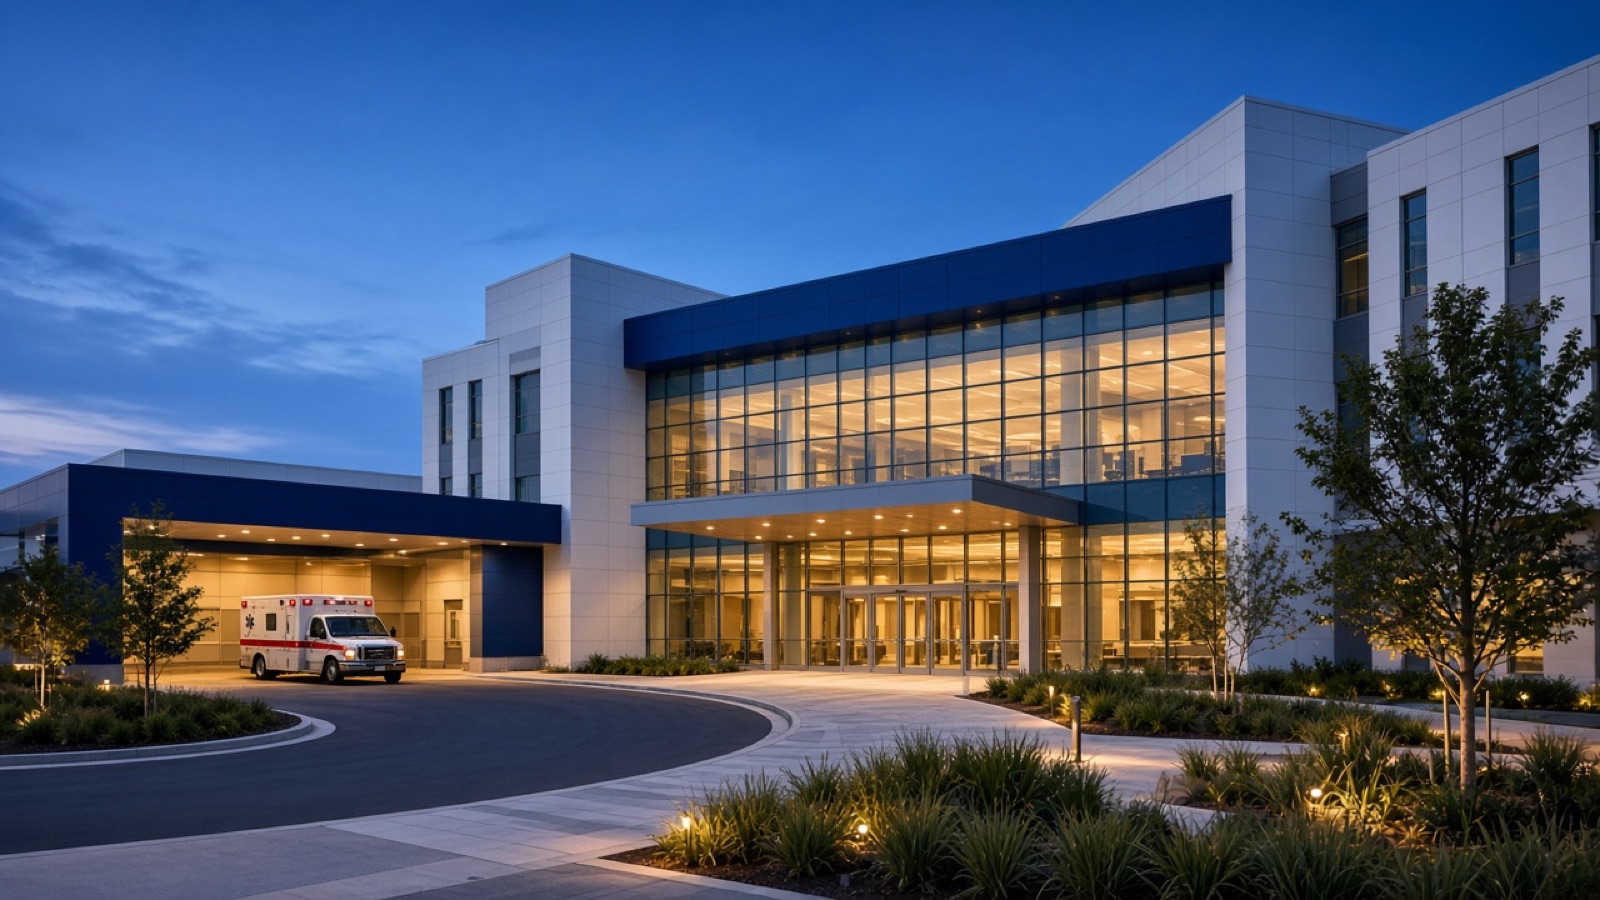
An outpatient department had a three-week wait and ran at 78% capacity. Non-attendance approached a quarter of booked slots, and because cancellations arrived by phone during clinic hours there was never time to backfill them.
Non-attendance prediction per booking from history, distance, appointment type and lead time. Automated confirmation and rebooking by voice and message in the patient's language. A standby list fillable within the hour, and selective overbooking only where the model was confident.
Non-attendance fell 38% and outpatient throughput rose 22% with no additional clinical headcount. Records and intake handling time fell 82% through document automation. No clinical decision was touched.
−38%
no-showsAppointment non-attendance
+22%
throughputOutpatient capacity recovered
−82%
admin timeRecords and intake handling

$1.7B
Client value generatedAcross 120+ signed value models
70%
Average efficiency gainMeasured post-rollout
99%
Client retentionClients continuing after project one
Where to go next.

The next case study on this page could be yours.
A two-week value assessment establishes the baseline, identifies the opportunity and commits to a target we are prepared to be measured against.